
Which States and Colleges saw the Most Fluctuations from 2004–2013?
Institutions of higher education typically attract ambitious people in pursuit of new experiences, knowledge, and solid careers. But during the last decade, student enrollment has been consistently inconsistent. This research uncovers the ebbs and flows of student enrollment across the U.S. between 2004 and 2013. By analyzing data from the National Center for Education Statistics, we pinpointed where and when across the U.S. total enrollment increased and decreased, which states saw the largest fluctuations in enrollment between 2004 and 2013, and which states have the most concentrated populations of enrolled students.
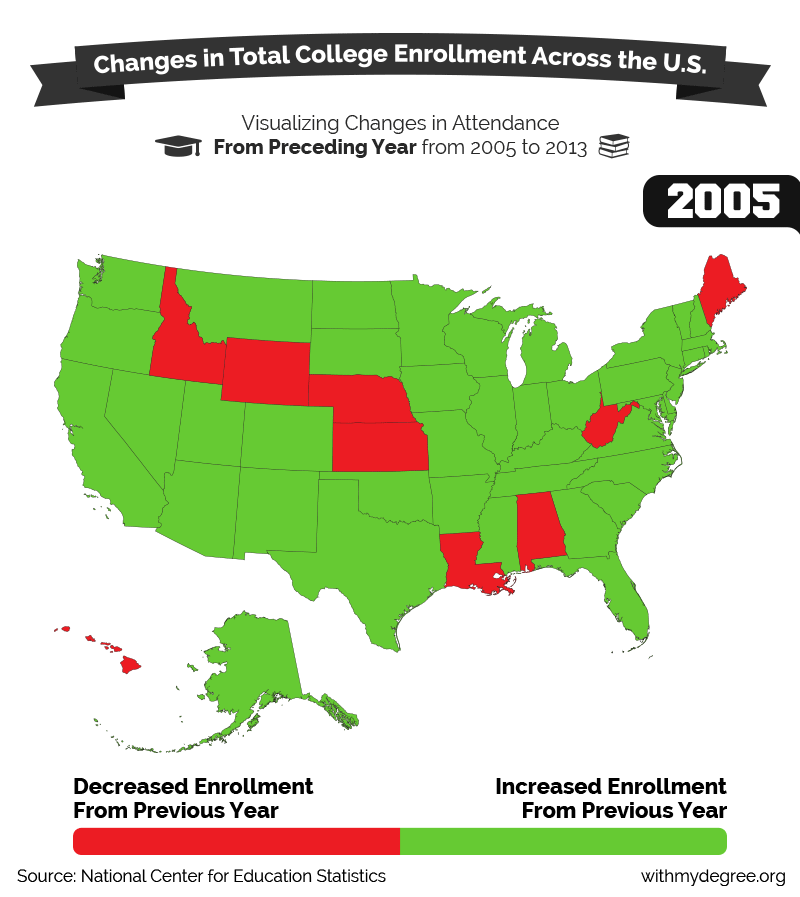
One of the most striking features of the above animated GIF is the fact that frames for 2009 and 2010 display an increase in total enrollment across all states. Why? Enrollment in college has jumped during every recession from the 1960s, according to Caroline Hoxby, a Stanford economist and author of “How the Financial Crisis and Great Recession Affected Higher Education.” It appears that after the 2008 financial crisis, students preferred to enroll in college – and stay enrolled – rather than face an uncertain job market where finding, keeping, and advancing in a career prove difficult.
But after the rise comes the inevitable fall. As the economy began to rebound, fewer students enrolled in college between 2011 and 2013. This cycle comes as no surprise: For some people, college is simply a backup plan after a stalled career search – and a newly thriving job market brings enticing money-making opportunities.
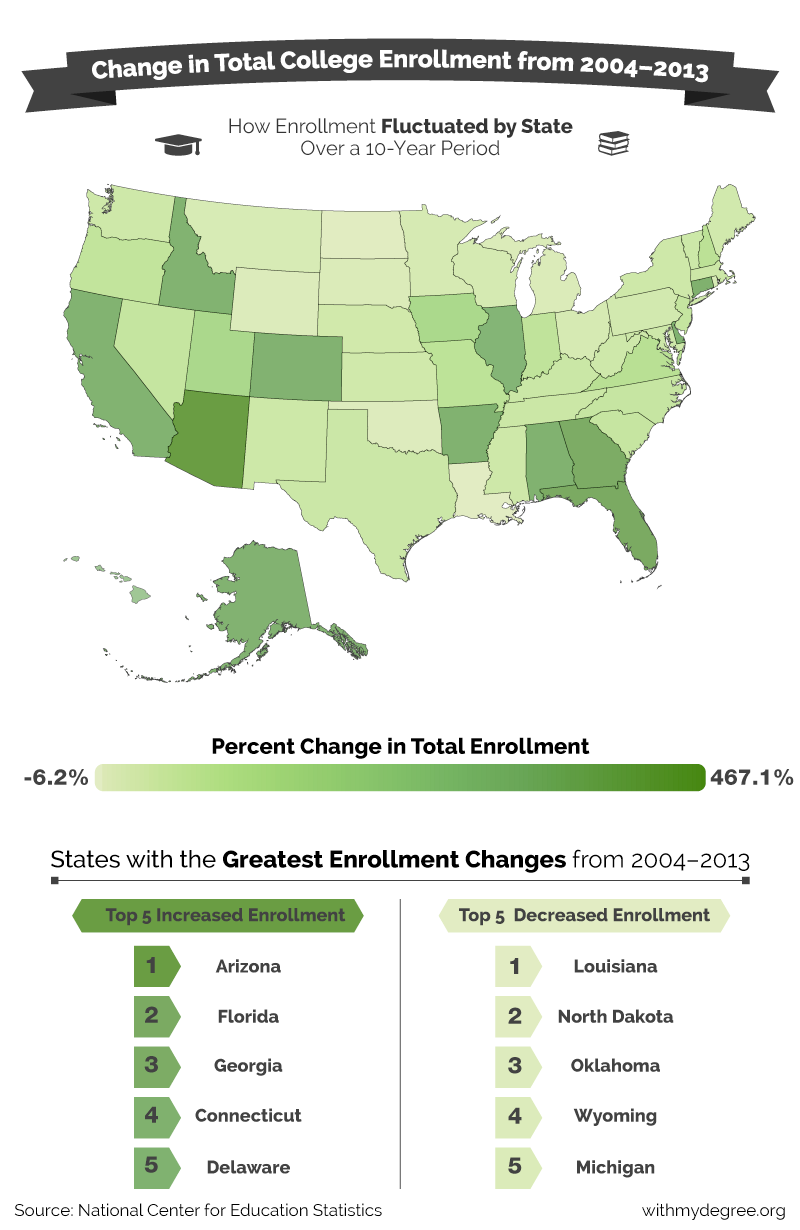
The map above reveals the increase and decrease of college enrollment by state. Both Arizona and Delaware experienced dramatic increases between 2004 and 2013. All three of the four-year institutions in Arizona grew in numbers, and in Delaware four of the five largest institutions drew more students. On the other end of the spectrum, North Dakota, Idaho, and South Dakota took the hardest hits in terms of declining enrollment.
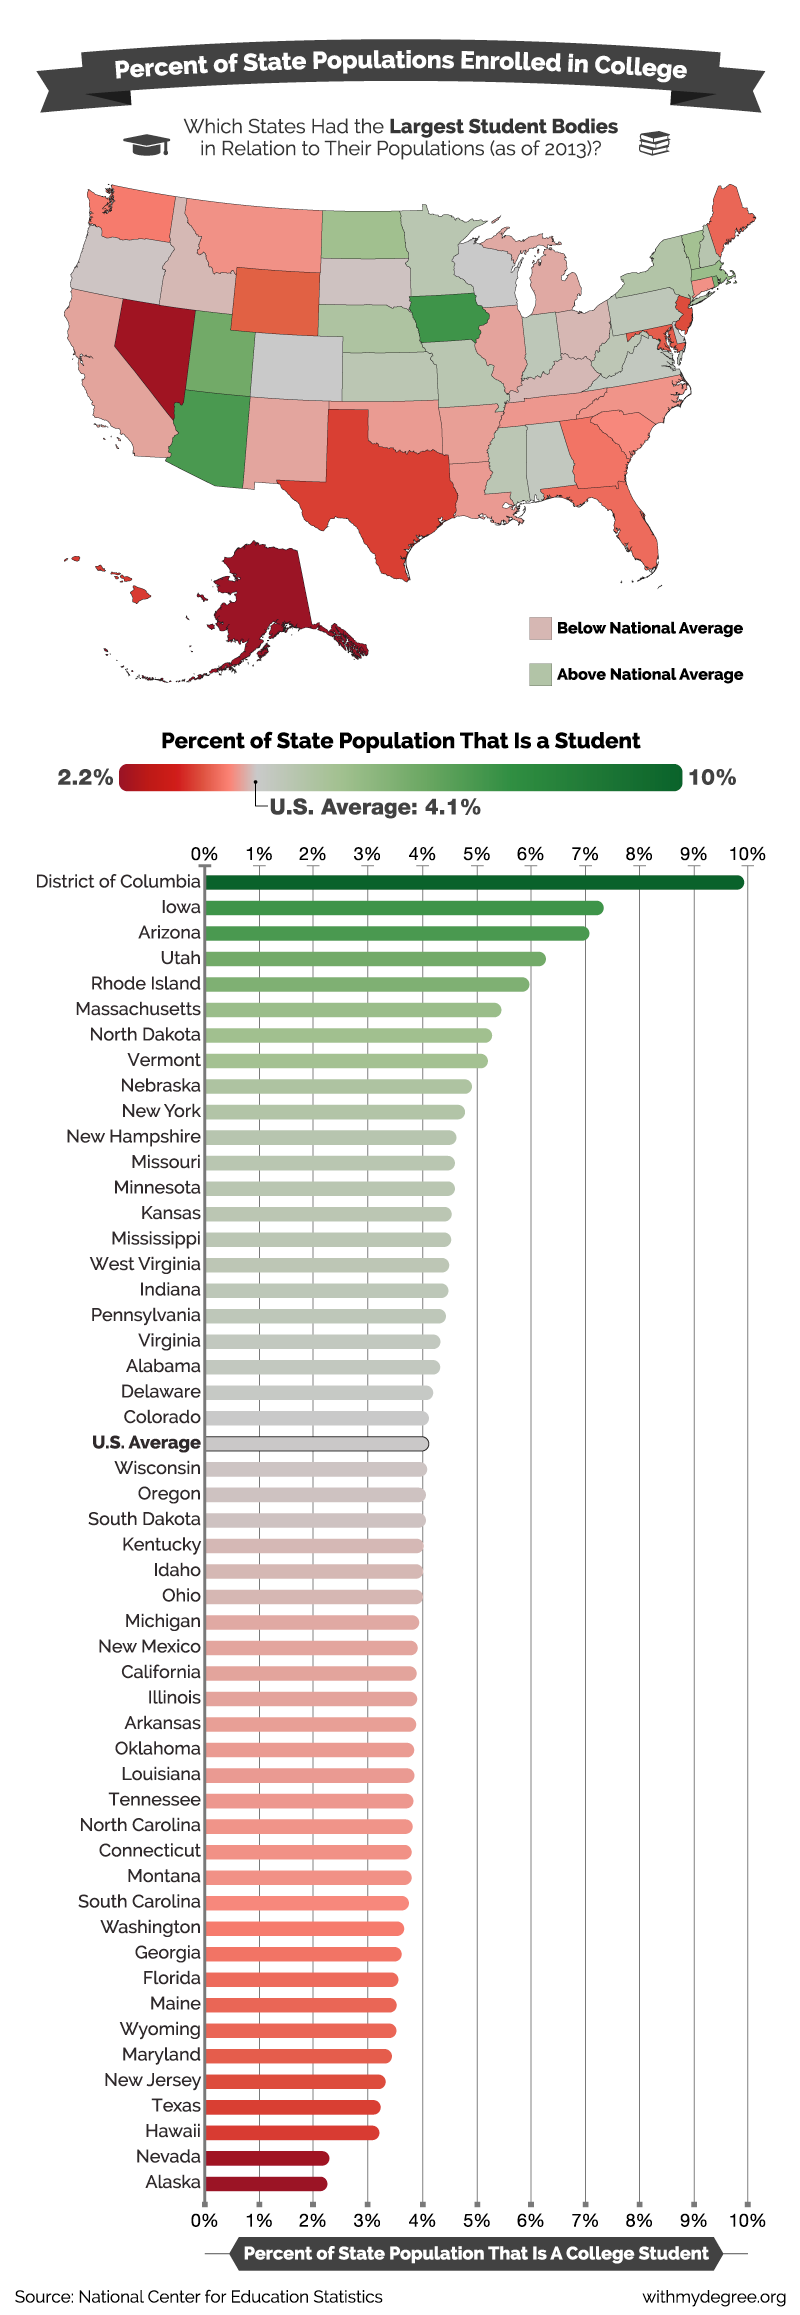
On average, around 4% of U.S. residents are currently enrolled in an institute of higher education. Zooming in on college enrollment by state reveals a dramatic fact: Nearly 10% of Washington, D.C., residents are students. D.C.’s focus on education comes as no surprise – after all, it’s the nerve center for the federal government – but its higher education statistics dwarf those of the rest of the country. In fact, more than half of D.C. residents hold college degrees. Iowa, Arizona, and Utah are next highest, with enrollment percentages hovering between 6% and 8%. Iowa and Arizona are both home to popular online universities with large student bodies: As of 2012, University of Phoenix in Arizona had more than 250,000 students, while Ashford University in Iowa enrolled almost 78,000.
At the bottom sits Alaska, where slightly more than 2% of state residents attend college or university. One theory? Many Alaskans may feel they’re able to forgo college in favor of successful careers in construction, fisheries, mining, oil, or tourism. Nevada, which received low rankings in a recent study focusing on children’s opportunities for academic success, follows closely. Hawaii, Texas, and New Jersey crack the 3% mark.
The Value of College
As our statistics reveal, the number of people who enroll in college greatly fluctuates. Often, times of economic prosperity see fewer people taking classes, while depressed times prompt higher enrollments. Each state faces unique challenges, from the quality of schooling to local career opportunities, and the numbers reflect these issues. But one fact remains true: The cost of not attending college is a steep one. From the size of their paychecks to their job satisfaction, college graduates are reaping the benefits of a degree compared with their less-educated peers.
Methodology
This research is based off of 12-month enrollment data from the National Center for Education Statistics data center. Institutions under consideration here are four-year private and public non-profit institutions in the U.S. Twelve-month enrollment numbers were retrieved for years 2004 through 2013.
Fair Use
WithMyDegree.org encourages the sharing, hosting, and redistribution of these images and results. When doing so, we ask that bloggers and journalists link to this page so their readers can access all assets available and be aware of the full methodology.